Dose Volume Histogram (DVH)-Toxicity Analysis
Oncospace allows us to relate dose to critical structure and toxicities observed for patients. This powerful
relationship helps us discover dose related sensitivities and can help support treatment plan decision-making.
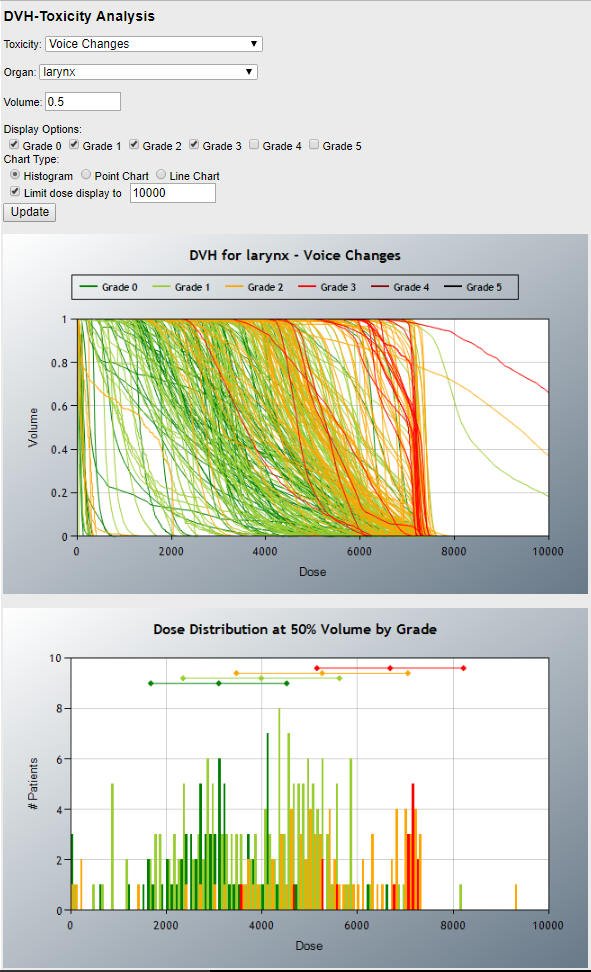
Plotted here are DVHs to the larynx of patients who have experienced voice change observations of grade 0-3.
The coloration of the top graph indicates a correlation between high doses to the OAR and this toxicity. The graph below
shows a consistently increasing dose level average (at 50% volume) as grade of toxicity increases.