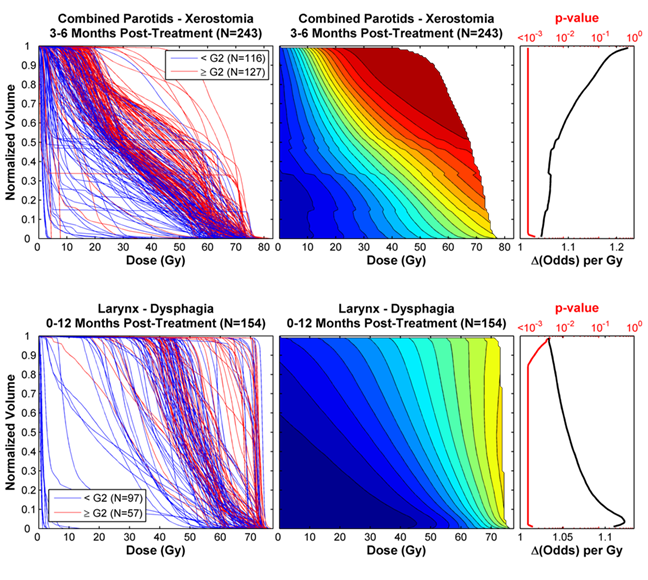
Outcome Probability as a Function of Dose
For this analysis, DVH curves are queried directly from Oncospace and are dichotomized according to an
outcome-specific threshold. For example, blue curves represent patients having an outcome (xerostomia or dysphagia)
of grades 0 or 1, with red curves denoting grade 2 or greater. A logistic regression model is applied to predict
the probability of an outcome as a function of the dose. Summary statistics are used to identify the most notable
relationships in our database. This primarily includes the p-value from logistic regression and the odds ratio,
which represents the change in the odds of a given outcome per unit dose.